My Mapping Reference Project Retrospective
A Python (Flask Framework), MySQL DB, ArcGIS Javascript, Ubuntu Server, Nginx, Gunicorn application running on an AWS EC2 instance Also previously implemented in PHP!
What is a Reference Project?
My definition of a reference project is an arbitrary complex project. that you the developer, knows how to solve, and usually like solving.
The goal is for it to act as a non-trivial learning aide. To assist in learning new tech, or to help push yourself to reach a new goal.
A common reference project is implementing something like a Sudoku solver every time you change language. With the hope that it gives you a good feel for the basics of the new language.
A complex project I like to do is a web-mapping app that integrates with a database full of Australian Census Data Pack data.
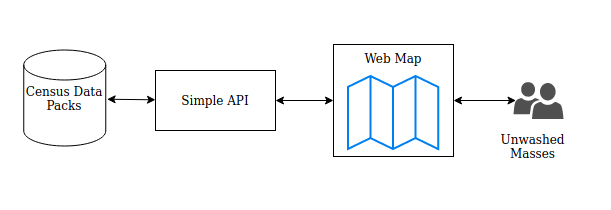
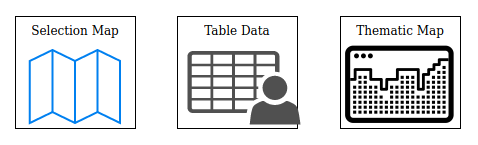
The idea is that a user makes a selection from a base map and the program provides them with a table of data and a thematic web map. It’s a simple CRUD application that actually has more use than something like a note-taking app.
I like this problem because there’s actually a lot to it. Front-ends, API’s and databases and it’s big enough that the focus can be on any of those parts.
A general overview of the application would be:
The Retrospective
About 4 years ago I build a PHP site I called CSV Ninja, The idea was to have a database full of data that was related to maps and then to use a map as a selection tool to select areas and topics that you wanted to get CSV data about. I built that and it amazingly worked.
About a year later I built an updated version of the app. As seen in the GIF below. It extended the original idea and implemented it in a new programming language to include dynamic visualizations. It was hard work. I didn’t know much Python or thematic web mapping, or really anything. And that somewhat shows with my hand-rolled flat CSS. However, Building this mapping app was a lot of fun and I was really proud of it all working in the end. So proud in fact that I’ve been paying about $1 a month to hang onto the Amazon EC2 instance that I put it all together on because I just can’t bring myself to get rid of it.
The other reason it’s been such a long-lived EC2 is that I also kind of forgot about it for a little over a year. I changed credit cards and forgot/ignored my AWS account. Which incidentally got cancelled for a period of time after I didn’t pay my monthly $1 to keep that EC2 alive. :P
I asked the AWS support team for my account back and they said “give us our $18 bucks”. So I did and my account came back! Along with my favorite little EC2. Which I then ignored for about another year whilst work got busy. If you can tell my childhood Tamagotchi didn’t last long
I plan on doing a bit more stuff with AWS in the near future and I don’t really need to pay for that server. So I want to preserve its loving memory by documenting it while I’ve still got it.
A GIF of the App in Action
The ABS Map Layers
The ABS - Australian Statistical Geography Standard is pretty important to understand the information that data packs contain. Simply put, every official boundary exists somewhere in a hierarchy of boundaries that are contained in Australia. In the above GIF you can see the Postal Areas (POA) layer.
If you follow that above link, there’s a few good diagrams and description which show the ASGS and related content. I’ve done up a tree diagram to also show the relations.
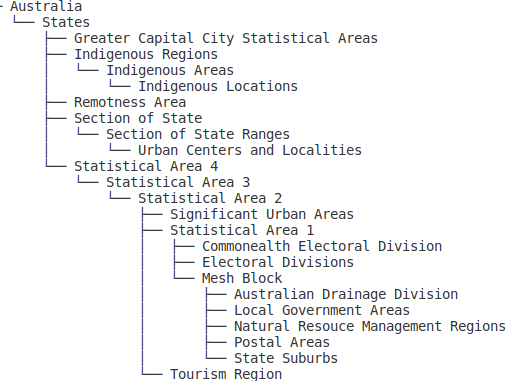
Just for some rough sizes, There’s 1 Australia, about 8000 Postal Areas, 56,000 Statistical Area 1 and, over 400K Mesh Blocks.
All the non-statistical areas like Postal Areas can be made up of a fitting set of Mesh Blocks. Which is hand if you have SA2 Statistics and want to fit them into Postal Areas. You can do complex analysis such as SA2 –> MeshBlocks –> Postal Areas. But thats not the topic of this writeup.
What is really nice about those boundaries is that every one of these areas has a unique code. Which sounds very much like the beginnings of a primary key. :)
What’s most important to know about the ASGS to also know the ABS publishes Shapefiles and a free ArcGIS service putting out the layers. Something which pretty much made this little application possible.
With all of that, I had data grouped by area, Maps of those Areas, and web services I could integrate it all into. Easy right?
Building the Database with all the gory CSV data
1.How you get the Census Data Packs from the ABS and what’s in them.
The Census Data Packs are really well -curated. You don’t need to worry about data quality or much input cleaning or any shaping of the data. The gory part is just dealing with so much information. After a while, it feels like sorting a lot of lego.
To get Census Data Packs Go Here. Good Luck!
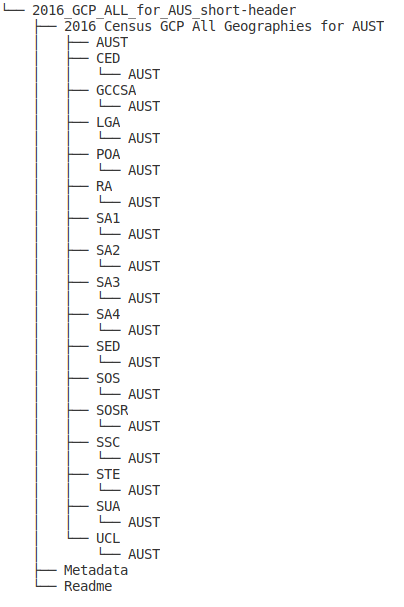
Below is a really nice picture of the folders that come with the ZIP file for the General Community Profile Data Packs. It’s nice because it doesn’t show the 50+ CSV’s that each leaf AUST folder contains.
When you open the data pack zip file up for the first time, you can look in the States (STE) folder and you’ll have ~50 CSV’s with 10 rows only, The numbers are pretty large for everything as it’s the rolled up totals for the states. Each folder going down the ASGS gets bigger and the numbers smaller. The 50 CSV’s represent the topics that are collected and extracted from the Census data. A personal observation is that the higher the CSV number, ie G15 and up, the more esoteric the topic is and usually smaller the numbers. This results in a lot of big sparse tables. And lots of Zeros.
In theory, the numbers from All the MeshBlocks in an SA3 should total up to match the totals given for the SA3. In practice, they don’t. And it’s totally fine. This is due to a privacy process that slightly alters the lower numbers to avoid disclosure of individual responses. It’s mostly an issue for topics with very sparse tables.
2.How I loaded it into the DB.
Once it clicked for me that each region had it’s own unique code and how I could use that I realized I could just smash all the layers into the same tables based on their source CSV. Mixing State and Postcode data without fear of each polluting the other.
From here I started building just over 60 MySQL database tables that matched the headers of each CSV to create my Census 2016 data packs database.
I now know there’s a lot of better ways to structure the database data, but the database always returned results quicker than the UI loading, so it was good enough for this. And importantly there’s always next time to work on the database design.
To import the data I did the following:
I wrote a single line bash statement to list all the CSV files for one level of geography to get the column information from the CSV’s
ls *.csv > file_list.sh
I used GEdit ‘search and replace’ to tack head -n 1 on the front and a redirect onto the end of each line in order to extract the column names from each CSV.
touch full_list.txt
head -n 1 .2016Census_G01_AUS.csv >> full_list.txt
head -n 1 .2016Census_G02_AUS.csv >> full_list.txt
head -n 1 .2016Census_G03_AUS.csv >> full_list.txt
....
etc up to G36
With this, I went the manual route and used MySQL Studio to assist in creating the tables. This took a few hours to do this. From memory, not all the ‘short’ names were short enough for MySQL and I wanted all the data included.
Thankfully no CSV’s columns exceeded the max width of a table in MySQL. Otherwise, I would have had to build a better-designed database and do a pivot to get the CSV’s into a long skinny table.
Eventually, the time came and I had my Database Schema.
This was probably the best part so far. I had a list of all the CSV files at every level and each mapped to a table correctly. From this list I built a script which would call from MySQL to perform a <em>load data local infile</em> to import the whole database. It only took about 6 minutes in total once this was all scripted up.
This was a fun script to run.
#MySQL load data local infile - Lots of these

>load data local infile '/.../../2016Census_G01_AUS.csv'
    into table c01
        fields terminated by ','
        optionally enclosed by '"'
        lines terminated by '\n'
        ignore 1 lines;
The API
At this point, I had tackled probably the biggest problem of sorting out all the data. Now was the application part of the project.
The PHP Version
I said at the start, this was a reference project for myself. I have built this database a few times. The first time was with the 2011 Census Data Packs and then again with the 2016 Release.
The CSV Ninja site has my working but, very very poor PHP code in it. It’s pretty much another version of the above app without the thematic map. I had originally envisaged it as a data selection tool where you’d drive your search by a map to retrieve CSV style data. It worked and did what I wanted, which was keep me sane during a slow 6 months at work.
Anyway, It was all plain PHP with no frameworks to help or hinder. The database was pretty similar and there really wasn’t an API. It was classic PHP all on a box!
CSVNinja Have a look if you like and don’t judge :D
The Python Part Replacing PHP was pretty simple. I wanted to do something more substantial with Python and needed some guide rails for structuring a simple REST API. Enter stage left: The Flask Framework
The requirements for the API were broadly to support the left to right flow of a user through the stages of the application:
- The API had to take a POST request from the front end selection map. Which contained a set of location codes and column variables.
- It had to then lint the content of that request,
- And then make the database lookup and send this data to a template on the data page.
- The Data page used the Jinja templating system to display the rows and column and also a button at the top of each column which said “Visualize”. If that button was pressed then a new page would open with a thematic map visualizing the data from that column of the user’s selection.
The two main files, views.py and query_proc.py have pretty much all these mechanical parts to the API logic.
From memory, Flask was very easy to work with. I dabbled with Django but that was a bit of overkill for this project. If I ever end up doing more in python, I’d happily use it again. Probably the only thing I’d do differently is to look at using some form of Swagger file to build up my API rather than rolling it by hand as I did during this.
The Selection part of the Front End
A year after the PHP version of this app, I decided I really wanted to do more dynamic map visualization stuff. I bought an actual paper book on the ArcGIS javascript framework! Which as expected was almost out of date the moment it arrived :D. I read it cover to cover and dit a lot of experimenting with the ArcGIS samples and HTML static maps. This really got me going with web mapping.
I did a lot of mapping work with just HTML 5 on single static pages. Usually to build one-off little helper apps for specific stuff.
The Selection tool was the index page and was pretty simple.
The basic requirements were:
-
Have a map. This is the very first tutorial on Esri. So starting out was simple.
-
Have a selection of layers that matched the Census Regions.
-
Provide a way to switch from those layers. Thankfully the ABS publishes these alongside the data packs and doing the switching isn’t too tricky. Probably the most significant thing was considering the user’s download burden. I’ve seen web mapping where the javascript ended up pulling down 5MB’s of junk to show a map. I impressively only pull down 2.3 :P (I am well aware that web mapping is a monster on bandwidth.)
-
Provide a way to select regions in those layers. The ArcGIS Javascript API is very large, and you can do a lot in it. I spent a lot of time working on this. The sample code really helped and really shaped my thoughts and opinions on how API’s and libraries should ship. There should be a lot more quick-starts out there!
-
Package a user’s selection into a post request and send it off to the flask API. This again was reasonably challenging at the time. I was new to javascript (do you ever not feel new to javascript?) and I fell in all the traps. I spent a lot of time thrashing about not really clicking with the event model and the mapping framework. But it all worked out in the end and I just packed up a bundle of JSON and sent it off to the backend with a matching set of column selections.
-
I also had to have a set of buttons that matched the available topics. This was really big. There were about 40 sets of selections and over 8000 columns to select from. The API provided an ajax method that would return the information to populate the options for a topic. Which a user could then select to get data from.
The Data Display part of the Front End
After the API got a set of columns and regions from the users. It would fetch a result set. The display logic was simply to pour that data out into a template. The most significant part of that process was that each column had a button that said “Visualize’ at the top. (I’ve currently acquiesced to just using American English as it’s what my spell checker supports and I’m not bothered by it.) When you pressed this button it would open a new tab and transmit the column of data to it. This would essentially be something like ‘Average household salary’ and the rows would be all the areas you were interested in. This data was perfect for thematic mapping.
The Thematic Map part of the Front End
After the user clicked Visualize, the new table would open and my custom javascript would parse over the data arrays and find all the regions of interest. Find their map extent and zoom into that area and, finally proceed to apply an ArcGIS class breaks renderer to it. The ArcGIS Class Breaks Renderer sample page was a great help here. As was ColorBrewer2 which was great for creating different color palettes for the renderer.
And that was the full front end.
Hosting environment
I used Ubuntu server 16.04 on an ec2 of some description. I hand-built it all. The Database in MySQL form is about 1.6 Gb so I had to expand the volume on the t2 instance I used. Other than that everything was stock.
Nginx acted as a reverse proxy for incoming connections.
Gunicorn was the Python WSGI Server.
And a really crappy and simple Systemd unit file turned all that into a service.
I followed a tutorial to get flask running on a web server but the eventual setup was to have it all configured as above. And before you about SSL remember I was trying to have fun here!
This wasn’t the tutorial I followed but it’s pretty much exactly what I did but with an older version of everything. Serving Flask with Gunicorn, Nginx, and Ubuntu
Final thoughts and things I realise in hindsight that were either stupid or I didn’t know better.
-
The database could have been better designed for the content. I could have either used a long skinny table design where I pivoted result tables from it. I would have used the region Id and column name as a composite key and then associated any extra metadata to the cell-based structure. Or alternatively, I could have kept with the table-like design but instead used a NoSQL database and managed a big soup of key values with Primary index’s on the region id and secondary indexes on the CSV table identifier allowing me to transmit extra information to the user and engage in some client-side caching strategies.
-
I probably should have had a crack at SSL :D considering is uber easy on AWS.
-
Whilst I was using Flask for the Rest API parts I could have extended the front end code with Vue or React or some fancy framework to add a bit more flare than my crappy HTML5 was offering.
-
I had 3 ‘screens’ when I really should have had everything happen in one place so the user experience wasn’t split. This would have been harder but I think it would have resulted in a better application.
-
I didn’t use any of the Mysql features to actually help. I went really light on stored procedures. So light in fact I had none! There’s a lot of work I could potentially push to the DB engine doing the data wrangling. If I do this application again in the future I think It’d be wise to lean hard on the DB.
-
There’s probably a lot more, but like always, I didn’t do some of the above because it’s sometimes more important to finish.
Finally
I’m pretty happy with what I got done in this project. Reflecting on myself and where I was at the time, it was a lot of new content and a good challenge. And I got to a point of finished I was aiming for.